机器学习之感知机。
感知机
感知机(perceptron)是二类分类的线性分类模型,其输入为实例的特征向量,输出为实例的类别,取+1和-1二值。感知机对应于输入空间(特征空间)中将实例划分为正负两类的分离超平面,属于判别模型。感知机学习旨在求出将训练数据进行线性划分的分离超平面,为此,导入基于误分类的损失函数,利用梯度下降法对损失函数进行极小化,求得感知机模型。感知机学习算法具有简单而易于实现的优点,分为原始形式和对偶形式。感知机预测是用学习得到的感知机模型对新的输入实例进行分类。感知机1957年由Rosenblatt提出,是神经网络与支持向量机的基础。
感知机的二分类模型
- 输入空间:X∈Rn,表示实例的特征向量
- 输出空间Y={+1, -1},实例的类别
- 感知机:f(x)=sign(w·x+b),w和b为感知机模型参数,w∈Rn表示权值向量,b∈R表示偏置
- 符号函数sign:x≥0时sign(x)=+1,x≤0时sign(x)=-1
- 超平面:线性方程w·x+b对应于特征空间中的一个超平面,将特征空间划分为两部分以完成分类。
- 损失函数:L(w,b)=-∑yi(w·xi+b)
python实现
1 | """ |
2 | 感知机解决二分类问题 |
3 | """ |
4 | |
5 | import pandas as pd |
6 | import numpy as np |
7 | from sklearn.datasets import load_iris |
8 | import matplotlib.pyplot as plt |
9 | |
10 | |
11 | # 感知机模型 |
12 | # 二分类数据线性可分(一元一次线性方程) |
13 | class Model: |
14 | def __init__(self): |
15 | self.w = np.ones(len(data[0]) - 1, dtype=np.float32) |
16 | self.b = 0 |
17 | self.l_rate = 0.1 |
18 | |
19 | # 符号函数 |
20 | def sign(self, x, w, b): |
21 | y = np.dot(x, w) + b |
22 | return y |
23 | |
24 | # 随机梯度下降法 |
25 | def fit(self, X_train, y_train): |
26 | is_wrong = False |
27 | while not is_wrong: |
28 | wrong_count = 0 |
29 | for d in range(len(X_train)): |
30 | X = X_train[d] |
31 | y = y_train[d] |
32 | if y * self.sign(X, self.w, self.b) <= 0: |
33 | self.w = self.w + self.l_rate * np.dot(y, X) |
34 | self.b = self.b + self.l_rate * y |
35 | wrong_count += 1 |
36 | if wrong_count == 0: |
37 | is_wrong = True |
38 | return 'Perceptron Model!' |
39 | |
40 | |
41 | # 手动实现的感知机模型 |
42 | def classifyByMe(): |
43 | # 用感知机模型进行分类 |
44 | perceptron = Model() |
45 | perceptron.fit(X, y) |
46 | # 画出散点图及分类结果 |
47 | x_points = np.linspace(4, 7, 10) |
48 | y_ = -(perceptron.w[0] * x_points + perceptron.b) / perceptron.w[1] |
49 | plt.plot(x_points, y_) |
50 | plt.plot(data[:50, 0], data[:50, 1], 'bo', color='blue', label='0') |
51 | plt.plot(data[50:100, 0], data[50:100, 1], 'bo', color='orange', label='1') |
52 | plt.xlabel('sepal length') |
53 | plt.ylabel('sepal width') |
54 | plt.legend() |
55 | plt.show() |
56 | |
57 | |
58 | # 使用scikit库里面的感知机模型 |
59 | def classifyByScikit(): |
60 | from sklearn.linear_model import Perceptron |
61 | # 用感知机模型进行分类 |
62 | clf = Perceptron(fit_intercept=False, max_iter=1000, shuffle=False) |
63 | clf.fit(X, y) |
64 | print(clf.coef_) # 权值向量 |
65 | print(clf.intercept_) # 截距 |
66 | |
67 | # 画出散点图及分类结果 |
68 | x_ponits = np.arange(4, 8) |
69 | y_ = -(clf.coef_[0][0] * x_ponits + clf.intercept_) / clf.coef_[0][1] |
70 | plt.plot(x_ponits, y_) |
71 | plt.plot(data[:50, 0], data[:50, 1], 'bo', color='blue', label='0') |
72 | plt.plot(data[50:100, 0], data[50:100, 1], 'bo', color='orange', label='1') |
73 | plt.xlabel('sepal length') |
74 | plt.ylabel('sepal width') |
75 | plt.legend() |
76 | plt.show() |
77 | |
78 | |
79 | if __name__ == '__main__': |
80 | # 加载iris数据集中两个分类的数据 |
81 | # 并以[sepal length,sepal width]作为特征 |
82 | iris = load_iris() |
83 | df = pd.DataFrame(iris.data, columns=iris.feature_names) |
84 | df['label'] = iris.target |
85 | df.columns = ['sepal length', 'sepal width', 'petal length', 'petal width', 'label'] |
86 | df.label.value_counts() |
87 | |
88 | # 画出散点图 |
89 | plt.scatter(df[:50]['sepal length'], df[:50]['sepal width'], label='0') |
90 | plt.scatter(df[50:100]['sepal length'], df[50:100]['sepal width'], label='1') |
91 | plt.xlabel('sepal length') |
92 | plt.ylabel('sepal width') |
93 | plt.legend() |
94 | plt.show() |
95 | |
96 | # 为感知机模型处理数据 |
97 | data = np.array(df.iloc[:100, [0, 1, -1]]) |
98 | X, y = data[:, : -1], data[:, -1] |
99 | y = np.array([1 if i == 1 else -1 for i in y]) |
100 | |
101 | # 感知机模型完成分类 |
102 | # classifyByMe() # 手动实现的感知机模型 |
103 | classifyByScikit() # 使用scikit库里面的感知机模型 |
分类结果
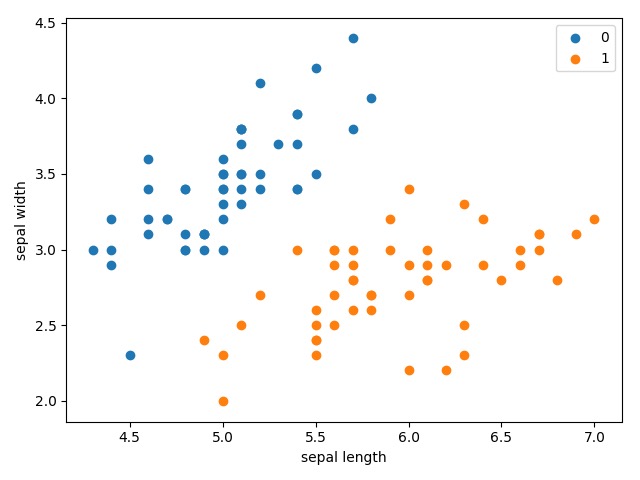
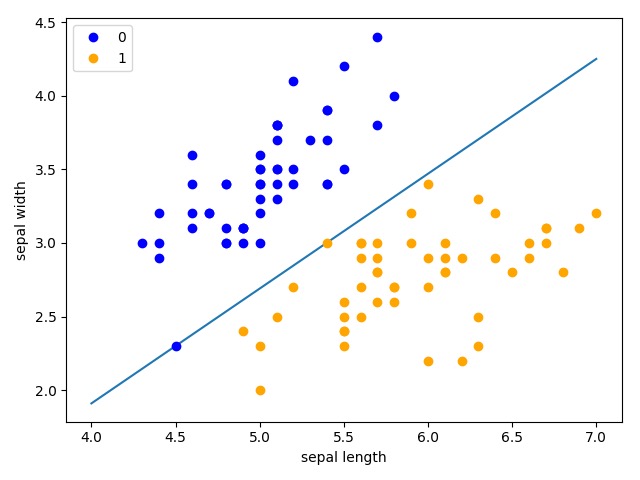
| 初始数据 | 分类结果 |
|---|---|
 |
 |
